
Prometheus, born at SoundCloud in 2012 and later adopted as a part of the Cloud Native Computing Foundation, is an open-source monitoring and alerting toolkit. It’s especially well-suited for reliability and scalability monitoring of containerized and cloud-native systems.
Prometheus is an open-source monitoring and alerting toolkit, originating from SoundCloud in 2012 and later becoming a part of the Cloud Native Computing Foundation. Designed primarily for reliability and scalability monitoring of containerized and cloud-native systems, Prometheus collects metrics from instrumented targets, storing them as time series data. Through its powerful query language, PromQL, users can extract insights, create dashboards, and set up alarms, making it an indispensable tool for maintaining the health, performance, and reliability of modern software infrastructures.
At its core, Prometheus scrapes metrics from instrumented jobs, either directly or via an intermediary gateway. It stores collected metrics as time series data, which can be queried via PromQL. This data is visualized through a built-in web UI or external tools like Grafana.
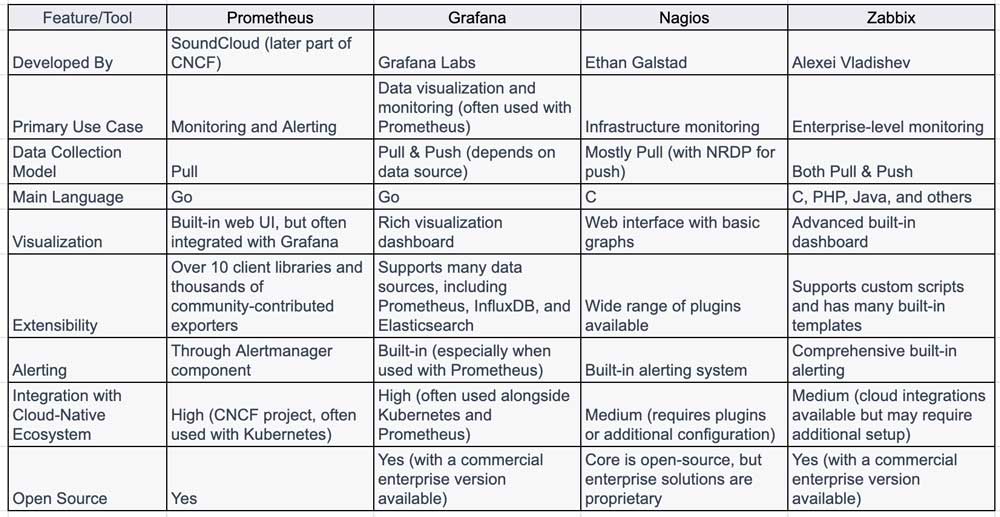
To understand how Prometheus works and what it does, it’s helpful to compare its features and functionality with similar monitoring and alerting tools. Below is a table that compares Prometheus to Grafana, Nagios, and Zabbix, the three closest alternatives.
You can install Prometheus using precompiled binaries or Docker:
docker run -p 9090:9090 prom/prometheusBefore you start Prometheus, you need a configuration file. A basic configuration file (prometheus.yml) might look like:
yamlCopy codeglobal:
  scrape_interval: 15s

scrape_configs:
  - job_name: 'prometheus'
    static_configs:
    - targets: ['localhost:9090']
This configuration instructs Prometheus to scrape its own metrics every 15 seconds.
Using the binary:
arduinoCopy code./prometheus --config.file=prometheus.ymlIf you used Docker, the container would need the configuration file mounted.
Once Prometheus is running, you can access the web interface at http://localhost:9090. From here, you can execute PromQL queries, view collected metrics, and more.
To start collecting metrics from your applications, you’ll need to instrument your code using one of the Prometheus client libraries. After instrumenting your application, add the necessary scrape configuration to your prometheus.yml and restart Prometheus.
To manage alerts, download and set up Alertmanager. Configure Prometheus to send alerts to Alertmanager by adding the required configuration to prometheus.yml.
Prometheus provides a powerful toolkit for monitoring and alerting in modern, dynamic environments. It’s extensible, supports a rich query language, and integrates seamlessly with a variety of visualization tools and dashboards. While the initial setup requires some effort, the flexibility and power it offers make it a vital tool in many DevOps toolchains.