Application Performance Management (APM) Software is a crucial tool for ensuring optimal application performance, reliability, and scalability. It tracks critical metrics, such as response times, error rates, and user satisfaction, providing organizations with the insights needed to improve digital experiences. Initially developed in the early 2000s to address growing web application complexity, APM tools have since evolved to accommodate modern architectures like microservices and cloud-native environments. Examples of popular APM software include Dynatrace, New Relic, AppDynamics, Datadog, and SolarWinds.
APM overlaps with categories such as IT Monitoring Software, Infrastructure Management Software, and DevOps Tools, highlighting its integration into the broader ecosystem of IT performance and operational excellence.

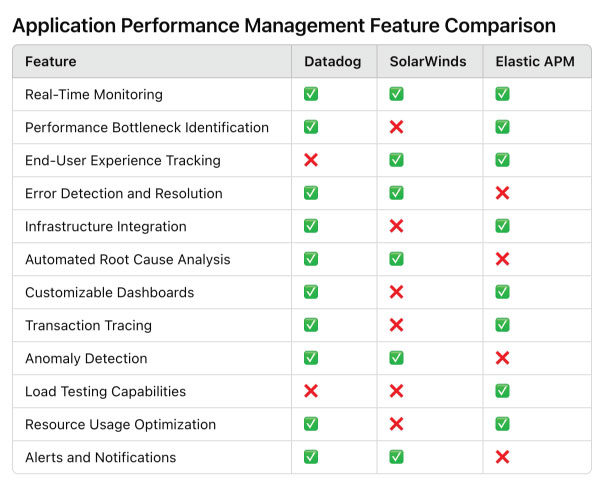
The following feature comparison table demonstrates how key APM tools compare in terms of functionality. This helps organizations choose the software that best aligns with their needs.

The feature comparison table highlights key differences and strengths among Datadog, SolarWinds, and Elastic APM. Datadog emerges as the most feature-complete, excelling in areas such as real-time monitoring, anomaly detection, and bottleneck identification. SolarWinds, while strong in end-user experience tracking and alerting, lacks advanced capabilities like load testing and transaction tracing. Elastic APM distinguishes itself with its open-source platform and robust load testing, though it falls short in error detection and alerts. This comparison demonstrates that each tool is suited for specific use cases, making it essential for organizations to prioritize their needs when selecting an APM solution.
In this video, you’ll gain a deeper understanding of how Application Performance Management (APM) software helps organizations ensure their applications run efficiently and reliably. The video introduces key concepts such as real-time monitoring, performance bottleneck identification, and end-user experience tracking. It also explores how APM tools leverage AI and automation to diagnose and resolve issues quickly, providing actionable insights to optimize performance across cloud, on-premise, and hybrid environments. Whether you’re an IT professional or a business leader, this overview will clarify how APM software can enhance your digital operations.
This dashboard represents a typical example of how Application Performance Management (APM) software provides actionable insights. It combines real-time metrics, system alerts, and detailed traces to help organizations monitor performance, identify bottlenecks, and ensure an optimal user experience. With its intuitive layout, the dashboard enables teams to proactively address issues, analyze resource usage, and fine-tune application behavior for maximum reliability and efficiency.

APM software offers comprehensive capabilities that empower businesses to monitor, troubleshoot, and optimize their applications. It provides real-time visibility into performance metrics, enabling teams to identify inefficiencies, improve application reliability, and enhance end-user experiences. Below, we explore the core features of APM software in detail.
APM software ensures optimal application performance by monitoring, diagnosing, and resolving performance issues.
APM tools provide deeper insights, including end-user behavior, transaction tracing, and real-time analytics, unlike traditional monitoring tools that focus on basic metrics.
Yes, many APM tools integrate with CI/CD pipelines, alerting systems, and collaboration platforms to enhance DevOps processes.
APM software addresses issues like slow application performance, bottlenecks, resource inefficiencies, and poor user experiences.
Yes, several APM solutions offer scalable pricing and features tailored to small businesses, such as basic monitoring and cloud integrations.
APM tools focus on monitoring application performance, tracking metrics such as response times, error rates, and transaction flows, and providing insights to optimize user experience. Observability tools, on the other hand, enable in-depth system analysis by gathering logs, metrics, and traces to diagnose issues in complex, distributed environments. APM is often a subset of observability but emphasizes real-time performance monitoring and alerting.
APM tools use distributed tracing to monitor transactions as they move through microservices. By assigning unique identifiers to each request, they track interactions across services, databases, and APIs. This helps identify bottlenecks, latency, or failures in specific components within complex architectures. Tools like New Relic and Datadog employ these techniques to visualize and debug transaction flows effectively.
Synthetic monitoring simulates user interactions with applications by running scripted tests to measure performance under controlled conditions. This helps in identifying potential issues before they affect users. RUM, on the other hand, collects data from real users as they interact with the application in real time, offering insights into actual user experiences, device performance, and regional variations. Together, they provide a comprehensive view of application performance.
Yes, APM software can optimize database performance by monitoring query execution times, database transactions, and resource usage. It identifies slow queries, indexing issues, and connection bottlenecks. Tools like AppDynamics and SolarWinds Database Performance Monitor provide detailed analytics and visualizations, enabling developers and database administrators to make targeted improvements for better performance.
Anomaly detection in APM uses machine learning algorithms to identify deviations from normal application behavior. By analyzing historical data and defining baseline metrics, APM tools like Dynatrace or Splunk can flag unexpected spikes in response times, error rates, or resource utilization. These insights help teams proactively address issues before they escalate into major outages.